Ceph cluster monitoring with Grafana
Contents
22. Ceph cluster monitoring with Grafana
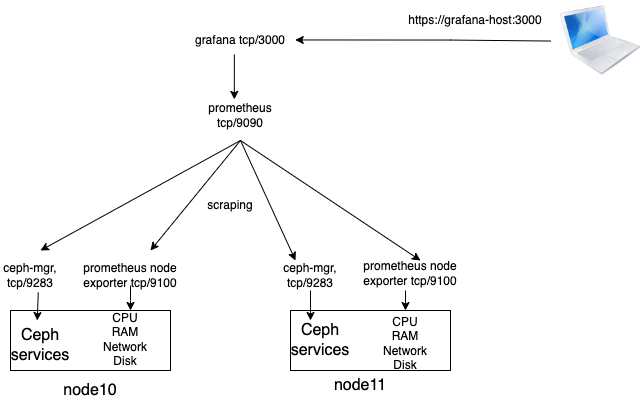
Grafana is a visualization tool that collects data and presents it in its dashboard, accessible from the web on port tcp/3000:
https://192.168.5.197:3000
Login: admin
Password: the same as on the cluster noders.
Grafana can collect data from various database sources, including:
Prometheus
InfluxDB
MySQL
Many others
22.1. Prometheus
The node exporter part collects data on a host about CPU, RAM utilization, Disk I/O, Network traffic, etc and presents it on port tcp/9100
The server scrapes all the node exporters, accumulates the data, and presents it to Grafana on port tcp/9090
22.2. Scraping configuration
In
/etc/prometheus/prometheus.ymlon the prometheus/grafana server, LXC with 192.168.5.197 in our case:
global:
  scrape_interval: 5s # Set the scrape interval to every 5 seconds. Default is every 1 minute.

scrape_configs:

 - job_name: 'ceph'
   static_configs:
     - targets: ['node10:9283', 'node11:9283']

 - job_name: 'node-exporter'
   static_configs:
     - targets: ['node10:9100', 'node11:9100']
Prometheus can also scrape the data from the Ceph managers. It checks them at port tcp/9283 above.
The Ceph managers on the Ceph cluster nodes need to enable the plugin for prometheus:
ceph mgr module enable prometheus
ceph config set mgr mgr/prometheus/server_addr 0.0.0.0
ceph config set mgr mgr/prometheus/server_port 9283
22.3. Example with Grafana monitoring node10 and node11